
Uncharted Territory: 35+ Maps For A Whole New Worldview
Throughout history, humans have cooked up some pretty nifty inventions, but few match the usefulness and resilience of maps. These clever doodads not only helped us wrap our heads around our surroundings but also chronicled the adventures of explorers and traders, more or less accurately.
If you’ve ever compared ancient maps with today’s versions, you’ll have a good laugh at just how comically off-track they could be. But hey, they’ve survived the ages and leveled up, now dabbling in everything from geographical data to continental info. So, buckle up as we take a peek at some maps and charts that’ll flip your perspective on its head!
Frog Sounds in Different Languages
Let’s kick things off with a blast from the past! You know what’s among our fondest childhood memories? Mastering the art of animal sounds. Well, not our sounds, mind you, but deciphering the unique calls and noises made by those furry and feathery friends of ours. Ah, the memories!

What tickled our funny bones was discovering that people from different corners of the globe hear animals in their own unique way. Check out this gem of an infographic map! It hilariously illustrates how various Europeans interpret the melodious croaks of our amphibian pals, the frogs. Who knew there were so many “crocking” variations?
How Different Languages Express Laughing Around the World
Speaking of how cultures see things through their own quirky lenses, it’s not just animal sounds—they’ve got their own spin on expressing laughter in written words too! This whole onomatopoeic laughter thing is another ballgame where every culture has its own play-by-play rules. Who knew chuckles and giggles could have such a diverse spelling bee?

Behold the laughter map—a delightful infographic showcasing how giggles go global! Those random letters in international jokes on social media? It’s just folks from different lands swapping laughs! Turns out, laughter truly is the universal language—even if it’s spelled a bit differently!
The Amount of Pigs in Europe
Whether it’s as sausages, bacon, smoked, or pulled, pork is one of the most popular meat choices in the world. Also, it is one of the most tasty and cheaper options for meat. Because of this, the demand for pork can be high.

Check out Europe’s porcine population! Looks like western France, Germany, and Denmark are hogging the piggy party! But hold your ham, Europe’s size versus those porky numbers? It’s a squeal-worthy revelation! Who knew pigs could throw such a barnyard bash in such a compact continent!
Most Popular Countries People Move to
Ever heard the saying, “The grass is always greener on the other side”? We’ve all peeked over borders, pondering if the grass is truly greener there. Admit it, we’ve all had a twinge of envy for lands that seemed more exciting than our ol’ familiar turf!

Yearning for a new adventure or lifestyle, folks jet off seeking change. Every year, a swarm of wanderers hop borders for new beginnings. This nifty infographic? It spills the beans on which countries are the hottest picks for these aspiring global nomads!
Rice Consumption in Europe
Starchy grains—our undying food obsession! Be it pasta, bread, spuds, or cereals, we are hooked! Among the starch royalty, rice reigns supreme. No matter the form, these carb wonders are the perpetual darlings of our plates. Starch for the win!

Rice has been a common feature in most human civilizations for centuries, if not millennia. It’s pretty nutritional, inexpensive, and easy to grow and cook. This infographic shows the annual rice consumption in Eurasian countries per capita. It’s lower than we expected.
Ice Cream Consumption in Europe
Speaking of the consumption of food, this next one is deliciously interesting. This infographic shows the annual consumption of ice cream in kgs and measured per capita in the European Union. Does anyone else feel like they are singlehandedly contributing to this data?
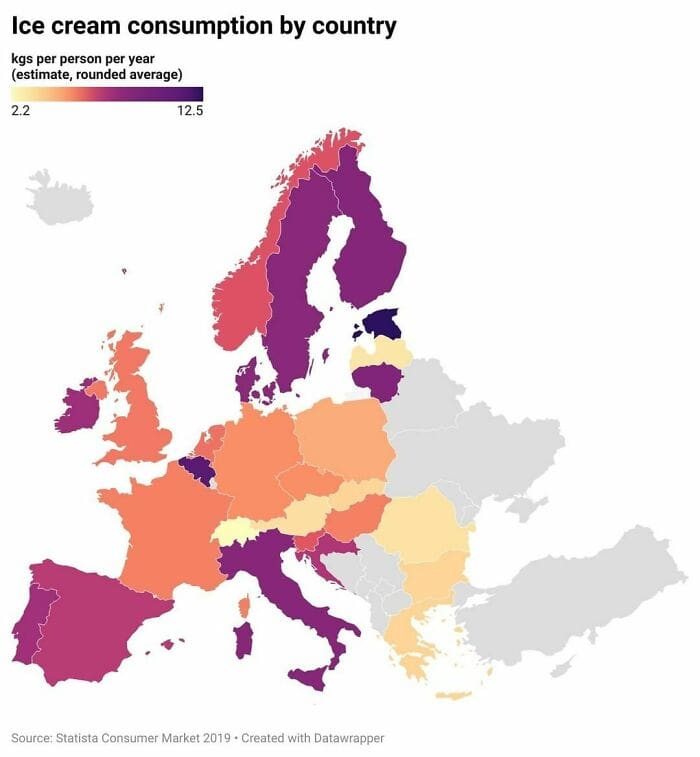
While it makes sense for warmer countries like Spain and Italy to consume a lot of ice cream, we were surprised by how much is consumed in Scandinavia. Maybe they are just so used to the cold at this point that it doesn’t bother them anymore.
Preferred Holiday Destination for Europeans Within Europe
Ever notice how everyone dreams of jetting off to Europe’s A-list cities? But wait, where do Europeans vacay in their backyard? It’s like the ultimate travel paradox. Forget six degrees of separation; we’re talking six hours of road trip to a neighboring country just for a holiday selfie!

This exciting map shows each country’s preferred destination, denoted by the flag placed on top of the country. The infographic also shows the percentage of the population that went abroad. As we can see, Spain is a very popular destination.
How Many Europeans Trust their News
As the old proverb goes, “Ignorance is bliss.” This proverb is sad yet increasingly applicable today as fewer people seem interested in global and local news. The reasons for this lack of interest are plenty. But there is one noteworthy one.

Here’s the scoop: folks are not keen on trusting news sources anymore. Whether it is sugar-coated, politically skewed, or downright propaganda, doubts arise about authenticity and transparency in reporting. Trust? It is like a rare unicorn in today’s news jungle!
How Many Europeans Avoid the News
Linked to the next infographic is a European news nugget—many dodge the news scene. True, distrust in news sources is a factor, but that’s not the lone ranger here. Multiple reasons abound why folks steer clear of the news carousel. Trust, or just another piece of the puzzle?

Let’s face it, news often packs a punch of sadness or gloom, and who wants that as their morning starter? Plus, in today’s world, distractions overflow—leaving little room for heavy news. From endless entertainment to a gazillion distractions, we’re spoilt for choice!
Map of Landlocked Countries
Ever noticed? Cities typically sprout near water sources, a no-brainer when you ponder it. Access to the sea? Equally crucial, right? It’s all about that H2O! When diving into city planning, it’s clear: where there is water, there is civilization’s heartbeat!

Access to the open waters tends to provide a country with means of fishing and transport. But sometimes some countries don’t have that luxury, instead being surrounded by other countries. This map shows all of the landlocked countries in the world.
How Many Billionaires There are in the World
The rich get richer, as the old saying goes. Every week or month, you seem to hear about some new millionaire or billionaire who’s had an absurd amount of money. This also raises the question: just how many billionaires are there now?

The graph above shows how many billionaires there were in 2021 and the countries they are from. Well, the billionaires that we know of. While that might look like a lot of people, it’s tiny compared to the global population.
European Passports and Their Countries
Passport designs are often overlooked but secretly captivating! They may not steal the spotlight, yet their simplicity holds deep symbolism. These design choices whisper tales about a nation’s roots and history, making them more than just travel companions—a glimpse into a country’s soul.

Check out this map of Europe! Passport pages and crests cover the countries, and guess what? Lots of red hues! Why, you ask? Well, most—though not all—are part of the European Union. Red seems to be the EU’s color code!
The World’s Population
Which leads quite nicely into our following infographic. Particularly for those curious about the size of the global population and the countries with the largest populations. All are cleverly arranged and structured in a pie chart for us to understand better.
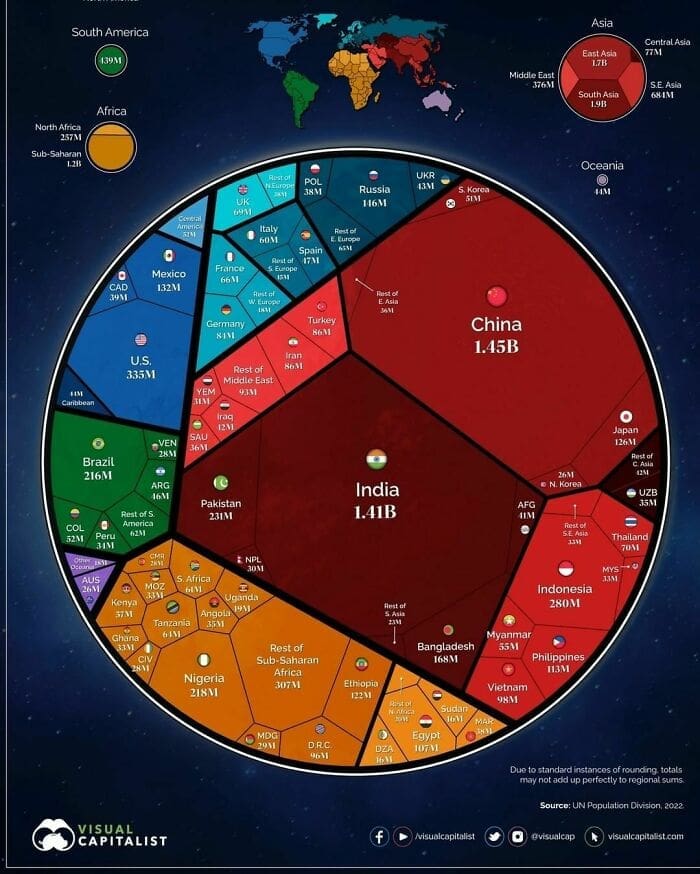
As we can see – and surprise there – China and India have the largest populations by far. The United States – being the third largest – doesn’t even come close to them. But then again, does anyone actually want to live in countries with that many people?
The Fastest Download Speeds in Europe
Speaking of what makes a country more desirable to live in, how important are internet speeds for you? If fast download speeds are important to you, then you might find this map quite interesting. Take a guess which European countries have the fastest speeds.
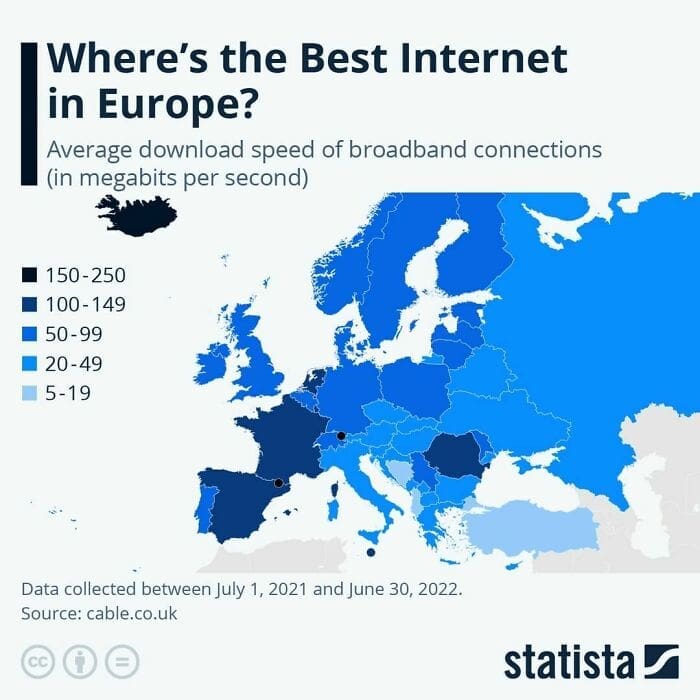
Scanning over this map, how many of you would ever have guessed that Iceland, Liechtenstein, and Andorra would have the fastest speeds? We can rationalize the other countries, but Andorra and Liechtenstein are so tiny, not to mention almost obscure!
How Much Sleep are People in Europe Getting
Curious minds might wonder if those zippy internet speeds above sparked this next infographic. We all nod to the importance of sleeping enough for good health. But hey, which European countries ace the snooze game? Time to uncover the sleep champs!
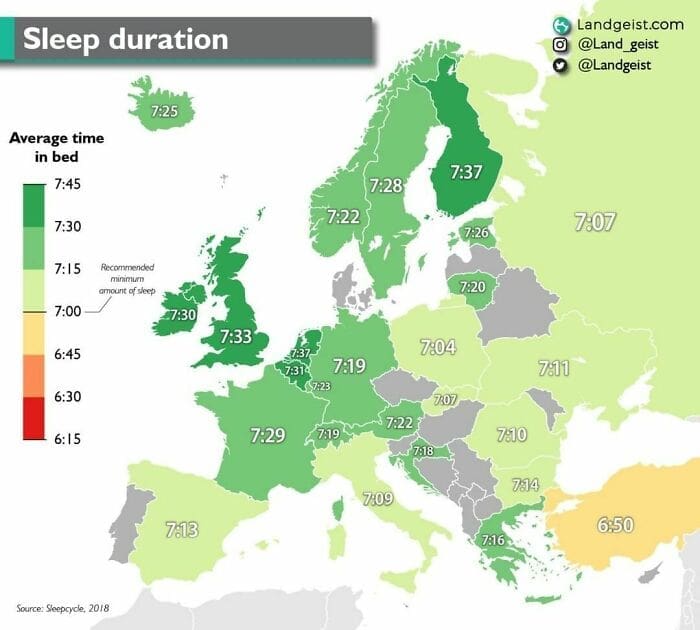
Spot the sleep champions! Central, Western, and Northern Europe are the siesta masters—basically the nap royalty of the continent. But, a quick disclaimer: our snooze-o-meter only tracks time in ‘bed,’ not actual sleep. So, they might be clocking in bed Olympics, but who knows how much Olympic-level snoring is!
How Much Sleep are People in Asia Getting
And for those wondering or from Asia, don’t worry; we got you covered. Let’s take a look at which Asian countries are catching the most shut-eye. At just a glance, we can already see that things are quite different in Asia.
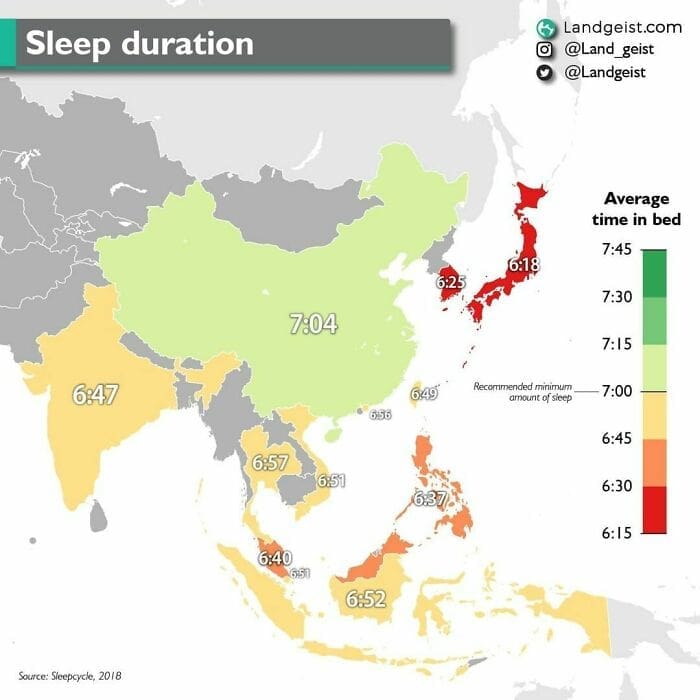
The infographic shows that most of the featured Asian countries are getting less sleep than those in Europe. While we don’t have a definitive answer, we imagine it has to do with stricter working conditions, which Japan and South Korea are known for.
The Most and Least Happiest Countries in the World
Now, this next one is likely to be a little controversial due to just how difficult it is to measure something like this. What you are looking at is an infographic depicting the most and least happiest countries in the world.
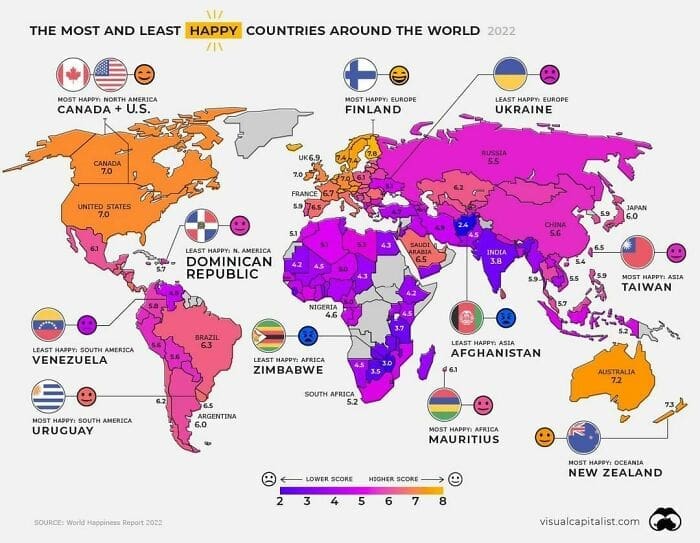
As we can see, much of Europe, Australia and North America rank among the happiest countries in the world. Asia and South America ranked in the middle, and Africa ranked at the bottom. That all said, we cannot attest to the accuracy of this infographic.
If Europe and the Americas Where in the Same Place
While maps and globes give us a good idea of what the world looks like and where everything is, they could be better. This is due to landmass getting stretched or compressed to fit everything on a map or globe.
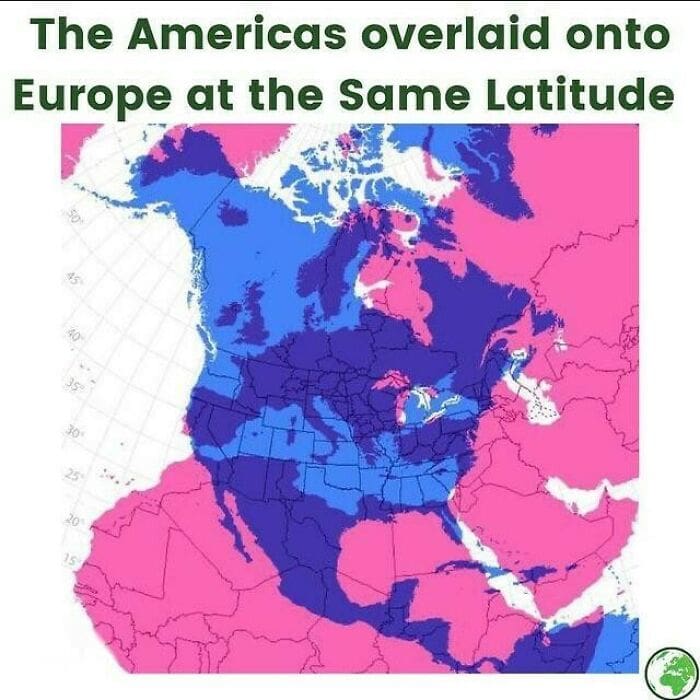
Often, this results in landmass appearing smaller or larger than you would expect. We know the Americas are big, but did you ever realize how big they were? When overlaying each country, you can see just how small Europe is.
The Current and Last Monarchs of Europe
When we think of monarchy and fancy kings, our minds tend to lead back to Europe. While other nations and cultures have had and have famous rulers of their own, Europe is more known to us in the Western world.
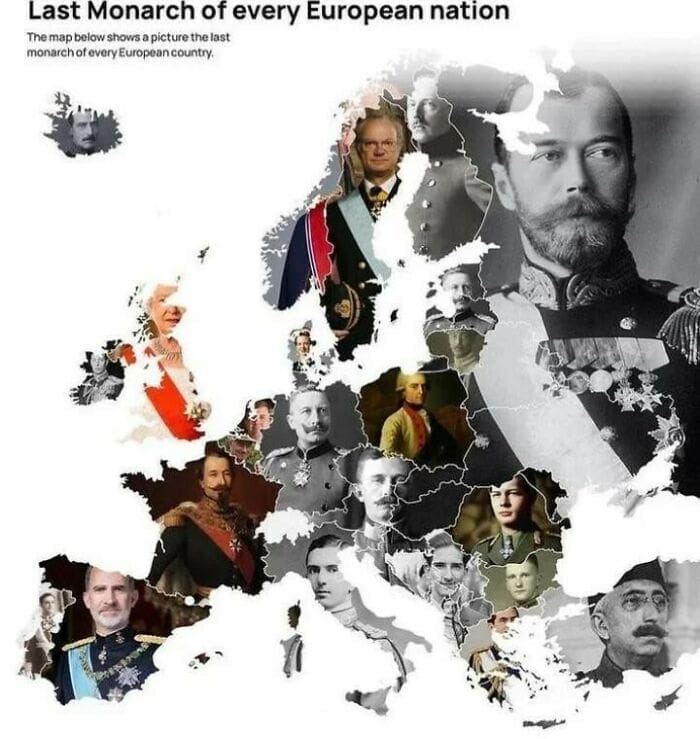
This fascinating infographic has an overlaid image of each country’s monarch stretched over them. Most of the photographed monarchs were also the last monarchs of their nations. The known exceptions are the UK, the Netherlands, Spain, and most of Scandinavia.
William Reed’s Top 10 Restaurants in the World
We all know the Michelin Guide and its holy stars, but have you met the unsung hero, William Reed Ltd.? It’s like discovering the secret sauce in the culinary world. It turns out there’s more to the food critic A-list than just Michelin—it’s time for a taste of the unexpected!
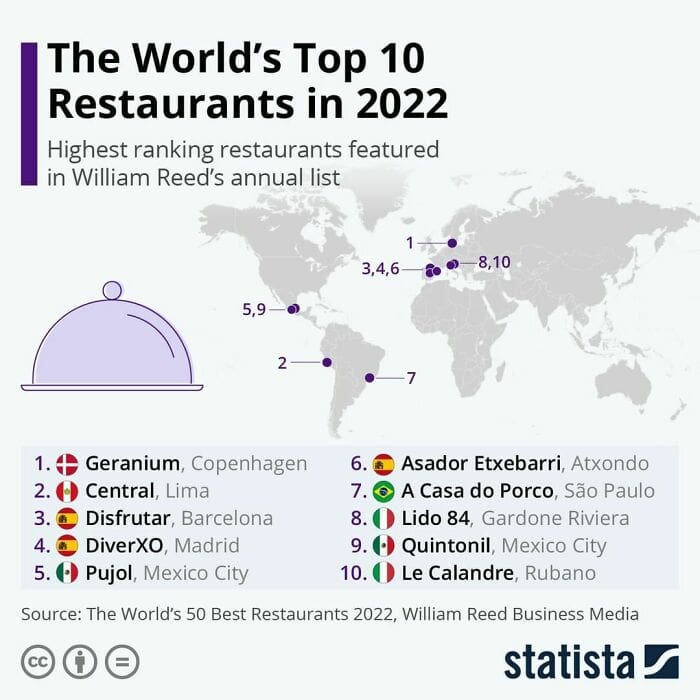
Have you ever heard of William Reed Ltd.? They’re like the foodie wizards of the digital realm. They whipped up their top 10 restaurants on the 2022 list, and let’s say it’s the culinary magic that leaves you scratching your head. Dubious or delicious? Time to taste the skepticism!
European Emigration Within Europe
It’s often interesting to see what certain people or cultures value in a place they want to move to. This infographic of Europe shows which countries are the most popular destinations for their respective citizens and how many of them live abroad.
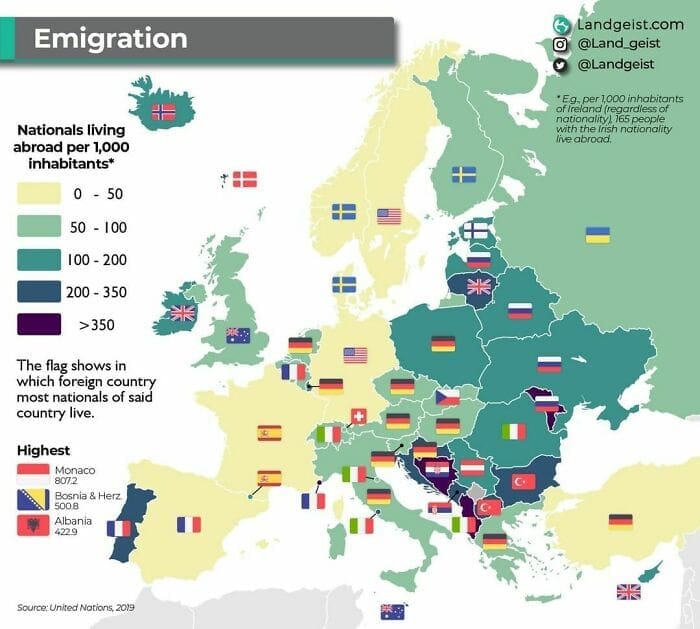
The flag placed on each country denotes the country most popular with that country’s population. Using France as an example, we can see Spain as the most popular destination. By and large, it looks like Germany is the most sought-after.
How Many Europeans Order Online
With the advancement of technology came many considerable changes to how we live our daily lives. Facture in global digital resellers and high-speed WIFI, and it’s no surprise ordering everything online from home has become the norm for most people.
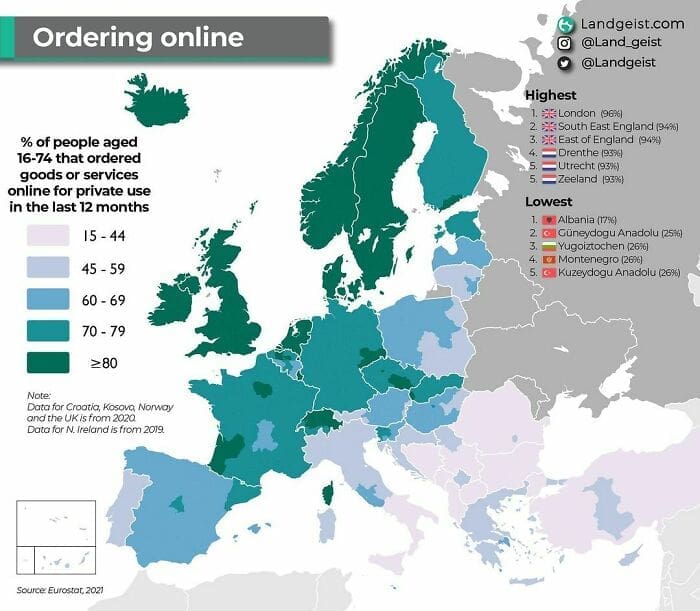
This infographic of Europe shows the percentage of Europeans who order online. The darker the color, the more people from those countries make online purchases. It surely looks like Western and Northern Europe make the most online purchases within the continent!
The Eye of the Sahara
When it comes to North Africa, few features are as famous as the gigantic Sahara Desert. It is A desert that covers 9.2 million square kilometers, making it the third-largest desert in the world. The biggest deserts, funnily enough, are in Antarctica and the Arctic!
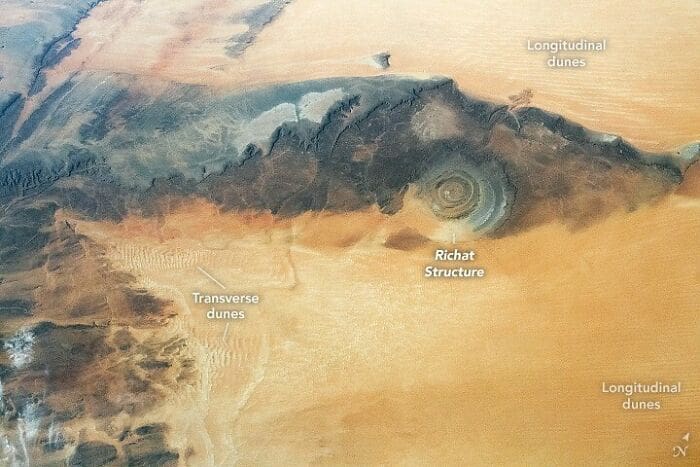
In the western part of Mauritania lies the geological feature known as the Richat Structure—Guelb er Richât in Arabic. A circular earthen formation that earned it the nickname the Eye of the Sahara. It is a mesmerizing and almost otherworldly attraction.
A Dust Cloud Over the Atlantic
And while we are still trekking across the Sahara, you are looking at gigantic dust clouds that blow from the desert across the Atlantic in 2022. The cloud was so large and carried with enough wind that it reached the Americas.

For those struggling to visualize that, that is a distance of close to 7,000 kilometers. And while this picture was taken in 2022, it’s apparently a yearly occurrence. It’s estimated that several hundred million tons of minerals and dust are blown over each year.
Migration of Millionaires
So far, we’ve looked at infographics that show how many billionaires there are in the world and infographics about popular migration and emigration destinations. Bring us to a combination of the two, being the migration habits of millionaires and where they go.

The countries coloured in green reflect inflows of millionaires into the country, while red reflects those that leave the country. Australia and Singapore seem to be the places of choice for these millionaires, while China and India and losing thousands.
Trick-or-Treating Around the World
Trick-or-treat. An anticipated and joyous time Halloween tradition for those in North America and a head-scratcher for those in the rest of the world. Even if you aren’t from America, you probably know all about it thanks to series and movies.

This infographic shows the countries that celebrate Halloween in orange, as well as similar traditions in the other coloured-in countries. While they are similar, we have no idea exactly what they celebrate; but thankfully, they are all named and easy to look up.
Most Used Energy Source in Europe
The growth of environmental awareness and our impact on the planet has led many to take a reflective look at what we can do differently. At how we can become more sustainable. With the matter of energy being the toughest obstacle.

While the more harmful energy sources like coal and oil are still the most dominant sources, things are improving. Especially in Europe where great efforts have been made to adopt Greener and more renewable alternatives, as shown in this infographic.
Road Quality in Europe
So far, we’ve seen some rather interesting infographics as well as some interesting topics they represented. Another interesting – if unexpected – one is this infographic on the quality of roads in Europe. Something which seems to be quite good for the most part.

Wonder if that has anything to do with the Romans and their fondness for roads. If it does, it doesn’t seem that fondness exists in modern Italy. We also wonder if the availability of good public transport takes some of the pressure off of the roads.
Global Wheat Production
We’ve already talked about the versatility and popularity of rice in Europe, but what about wheat? No matter the culture or where in the world one lives, wheat has been a dietary staple of the human race for thousands of years.

A reliance which means there is a high demand to produce more and more of it. This infographic recorded the amount of wheat produced in various countries between 2000-2020. No surprise China, India, and the US are amongst the largest producers.
GPS Tracking of Polar Bears
Okay, we were not expecting this next infographic at all, but we sure are happy we came across it. At a glance, you are probably wondering just what you are looking at. Well, the answer is polar bears in the Chukchi Sea.
The Chukchi Sea lies between the shores of Siberia and Alaska and flows into the Arctic Ocean. Getting back to polar bears, this infographic shows the movement patterns of polar bears passing through the area, using GPS trackers to record them.
5G Networks Around the World
With each passing year come scores of technological advancements that seem to be advancing at ever-increasing speeds. Often rendering many technological inventions outdated within a handful of years, or fewer in some cases. A fine example being WIFI and telecommunication networks.

5G networks were first revealed back in 2016 and gradually deployed worldwide by 2019, with some interesting public reactions. This map shows the current state of 5G networks around the world, with a surprising number of countries already using it.
Cargo and Shipping in the North Sea
Now, this next one isn’t as interesting as some of the other infographics we’ve seen. We definitely thought so at first, but the more time we spent looking at infographics, the more we came to appreciate how interesting even seemingly dull ones could be.

What you are looking at was a massive ship and cargo jam that occurred in 2022 in the North Sea around Belgium and the Netherlands. The North Sea is regarded as one of the busiest shipping routes in the world.
A History of Terms of Sale… Terms
Have you ever wondered why some things are almost universally known by one name, while things are known by many names? Well, it all goes back to trade and something linguists call Wanderworter, or ‘migrant word’, a loanword adopted by many cultures.

This map illustrates a number of unique items or products that are all known by a variant of the same name, and the paths they travelled through trade. Everyday products such as tomatoes, cotton, and tea are fantastic Wanderworter examples.
Real-estate Bubble Risk of 2022
While life in the modern world is far better than what it was only a century ago, it’s also a lot more expensive. One of the best cases being the maddening and ever-increasing housing prices. Which in worst cases, leads to a real-estate or housing bubble.

This infographic recorded the countries and cities most at risk of real-estate bubbles in 2022. Looking over the map, it’s no surprise that most cities either at risk or overvalued, are also the most in-demand and popular cities in the world.
Modern vs. Historical Grizzly Bear Ranges
While human progress and advancement have brought with them a score of benefits, it has also taken a heavy toll. As our cities grew larger and our need for resources increased, the natural world around us began to shrink and diminish.

This map of North America shows the historical range of the grizzly bear (brown bear) and the much-reduced current range. These bears once roamed from the northern parts of Mexico all the way to Alaska, to now only Alaska and parts of Canada.
The Price of Gasoline Around the World
Speaking of the advancement of time. We are all painfully aware of how expensive things have gotten – and are getting -, but the price of gasoline is just getting crazier and crazier. And depending on where you live, it could be worse.

The data provided in this infographic map gives us a pretty good understanding of how the price of gasoline differs from country to country. While it’s quite cheap in most of Africa all the way to Russia, it’s really expensive everywhere else.
Generation of Hydroelectricity Across the World
This next entry links rather nicely to the two previous entries. As the world becomes more aware of their environmental responsibility, many countries are searching for and developing more environmentally friendly sources of energy. One such Green energy source being hydroelectricity.

We must say, it’s a little funny that Greenland happens to be one of the leading Green countries when it comes to hydroelectricity. Unfortunately, a country has to be near a strong source of flowing water to generate any meaningful amount of power.
What Percentage of Each Asian Country Lives in their Largest Cities
Most of us are probably aware that when it comes to places where to live, most of a country’s population will tend to live around the country’s largest cities. Generally motivated for work reasons, which is why most young people move to the big cities.

This map shows what percentage of a country’s population lives in the country’s largest metropolitan area, like the capital city. In gigantic countries such as China and India, it isn’t much of an issue. But it is in smaller countries like Japan and South Korea.
Importance of Religion in Europe
As times change, so do the sensibilities and values of a people and what they view as important. While Europe might have once been the centre of Christianity, it isn’t as important as it once was for many people living today.

This statement rings true for most of Central and Northern European countries that don’t see religion as particularly important. While it is stronger among the Mediterranean countries, it is stronger in Eastern Europe, particularly in Greece, Romania, and Bosnia and Herzegovina.
GDP Output and Labour in Europe
Okay, this one is a little bit more complicated, or complex than some of the other ones we’ve had. This infographic is focused on the amount of GDP (gross domestic product) output a country makes in an hour on average.

Still with us? We told you it was complicated. It’s important to note that GDP is not the same as income per capita, which measures the actual amount of money that average people earn. In most cases, GDP only benefits a select few individuals or businesses.